Performance
Read the performance charts of hosts, virtual machines and datastores in the console, choose a period and scrape the samples with Prometheus.
Kyvernon keeps performance samples of hosts, virtual machines and datastores in the controller, and the console draws them as charts on the tab of the object. The host agents report the samples every 20 seconds, and the controller rolls them up into longer periods.
In the console
In the inventory, select a host, a virtual machine or a datastore, and open the tab Monitor.
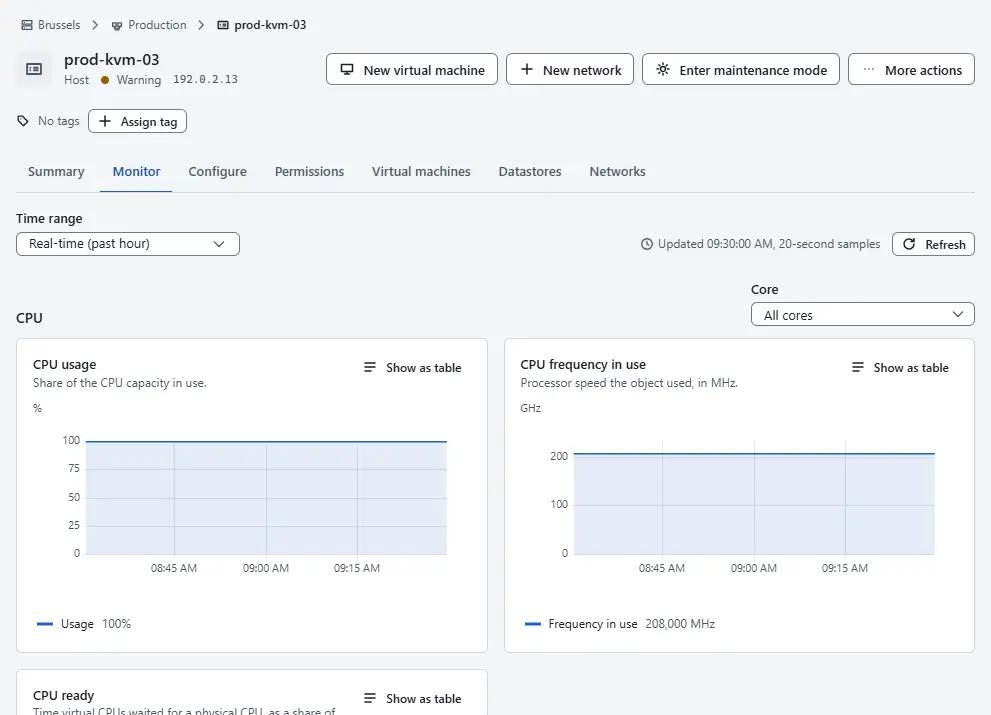
Choose the period under Time range. Each period has its own sampling and is kept for a limited time:
Period Sampling Kept for Real-time (past hour) 20 seconds 1 hour Past day 5 minutes 1 day Past week 30 minutes 7 days Past month 2 hours 30 days Past year 1 day 365 days - For another stretch of time, choose Custom range, enter From and To, and select Show range. The samples are fitted to the range. The end must be after the start.
Read the charts. A virtual machine has the sections CPU, Memory, Disk and Network, for example CPU usage, CPU ready, Disk latency and Dropped packets. A datastore has the sections Space and Performance. Select a series in the legend to hide or show it.
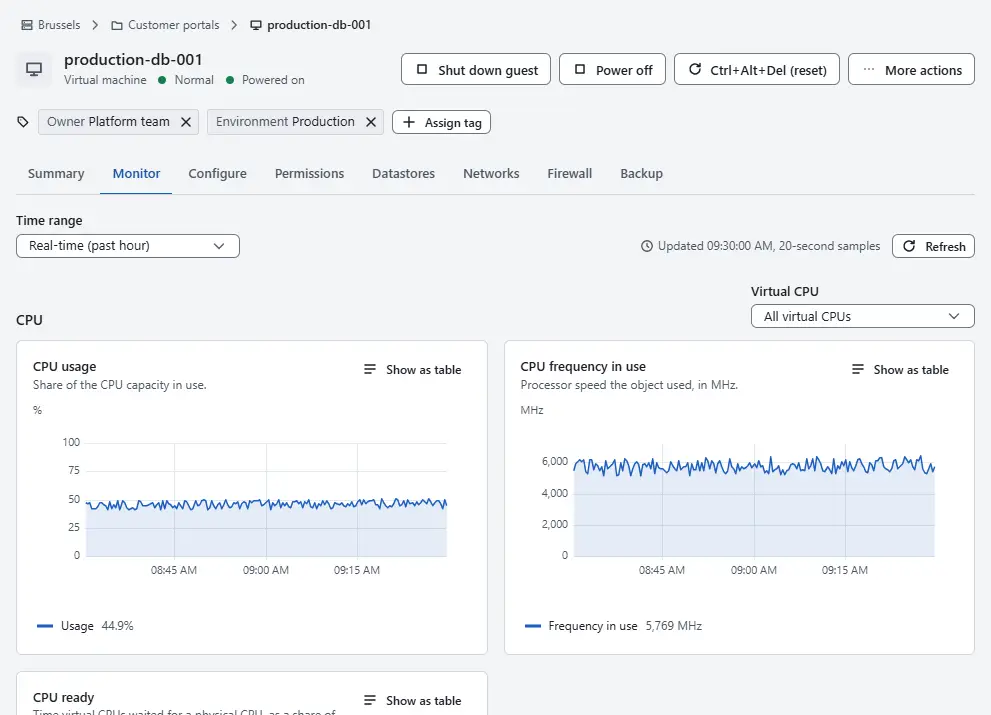
- Select Show as table to read the values with Minimum, Average, Maximum and Latest. Select Refresh to read the charts again; the line next to it says when they were last read and with which sampling.


Charts are kept per host, virtual machine and datastore. A cluster, datacenter, folder or network shows no chart of its own: open one of its members. A powered-off virtual machine reports no samples, so its charts show the periods in which it ran. Samples for single cores, disks and adapters are kept for the real-time period.
Result
The charts show the counters of the object for the chosen period. A counter has a name of the form group.name.rollup, for example cpu.usage.average, and the groups are cpu, mem, disk, net, datastore, virtualDisk, sys and rescpu. Usage reports consumption from the same data, and an alarm reacts to events.
The administrator controls how much is kept through the section [metrics] of the controller configuration: whether performance data is kept at all, the size of the metrics file, how long the charts of a deleted object stay (7 days by default) and whether samples are pushed to an OpenTelemetry endpoint. Nothing leaves the controller unless that is configured. The keys are in the configuration reference.
Automation
With the CLI
kyvernon metrics counters
kyvernon metrics available vm-42 --interval 300
kyvernon metrics query --entity vm-42 --counter cpu.usage.average --interval 300 --max-samples 12
--interval is the sampling period in seconds: 20, 300, 1800, 7200 or 86400. --entity and --counter take lists separated by commas. --instance is empty for the aggregate, * for all instances such as every disk, or one instance. --start is exclusive and --end inclusive, both in RFC 3339 form. The answer is column-oriented, with timestamps and values per series, which suits charting.
With the API
GET /v1/metrics/counters and GET /v1/metrics/intervals list the counters and the periods. GET /v1/metrics/entities/{id}/available?interval=<seconds> lists the counters with data for an object. GET /v1/metrics/query returns samples with entity, counter, interval, start, end, instance and maxSamples, and POST /v1/metrics/query takes the same as a JSON body. A query returns data for the objects that the caller can see. A query that names no object or counter, asks for too many samples or uses an unsupported period fails with a message id of the area metrics; see error.metrics_query_too_large.
With Prometheus
GET /metrics/perf answers in the Prometheus text format with the newest sample of each series, for the hosts, virtual machines and datastores that the token may see. Each metric is named kyvernon_perf_<group>_<name>_<unit>, for example kyvernon_perf_cpu_usage_percent, and has the labels entity, entity_type, name and instance. Create an API token of a user with read access and give it to Prometheus as its bearer credential, with /metrics/perf as the metrics path of the scrape job and your controller address as the target, for example controller.example.com:8443. An administrator can allow scrapes without a token with the setting anonymous in the section [metrics]; leave it off unless the network is closed.
Related
Version 0.1. Last changed: 2026-11-14