Usage
Report the consumption of virtual machines and tenants per day or month in the console and download it as CSV for chargeback.
The usage ledger records, for every virtual machine and every day, what it consumed. A report adds the lines up by virtual machine or by tenant, per day, per month or for the whole period. The figures are commercial data, so you need the privilege Kyvernon.Usage.Read on the root; the read-only role does not hold it. Without it the page says You do not have permission to view usage.
In the console
Open the home page (Home) and select Usage under Shortcuts. To report on part of the inventory, open a folder or a cluster instead and select its tab Usage; only the virtual machines inside it count.
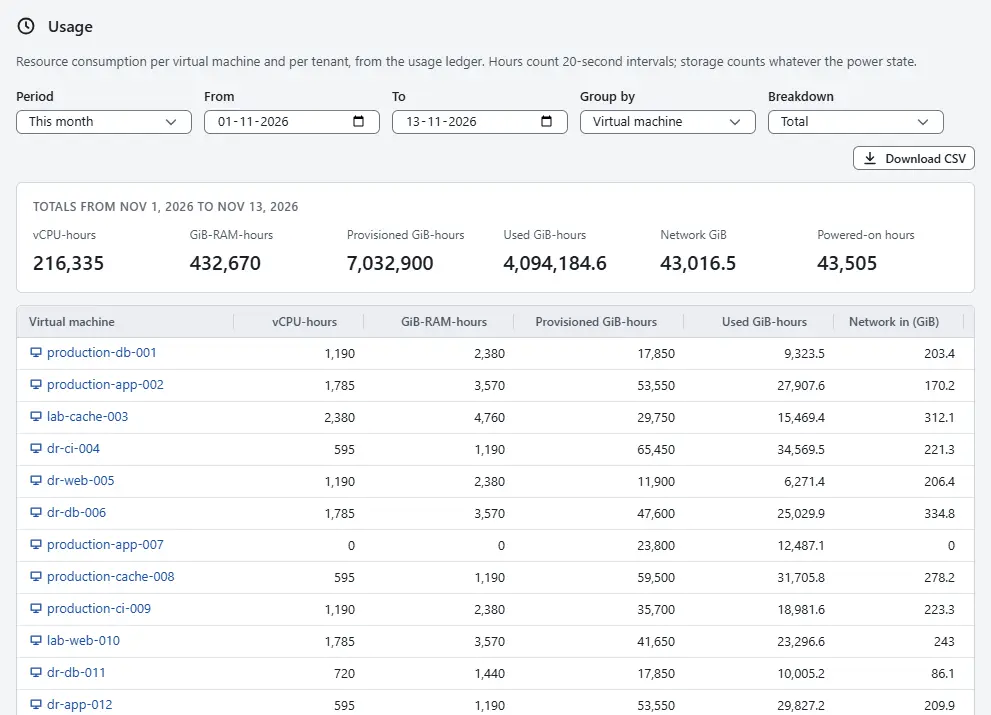
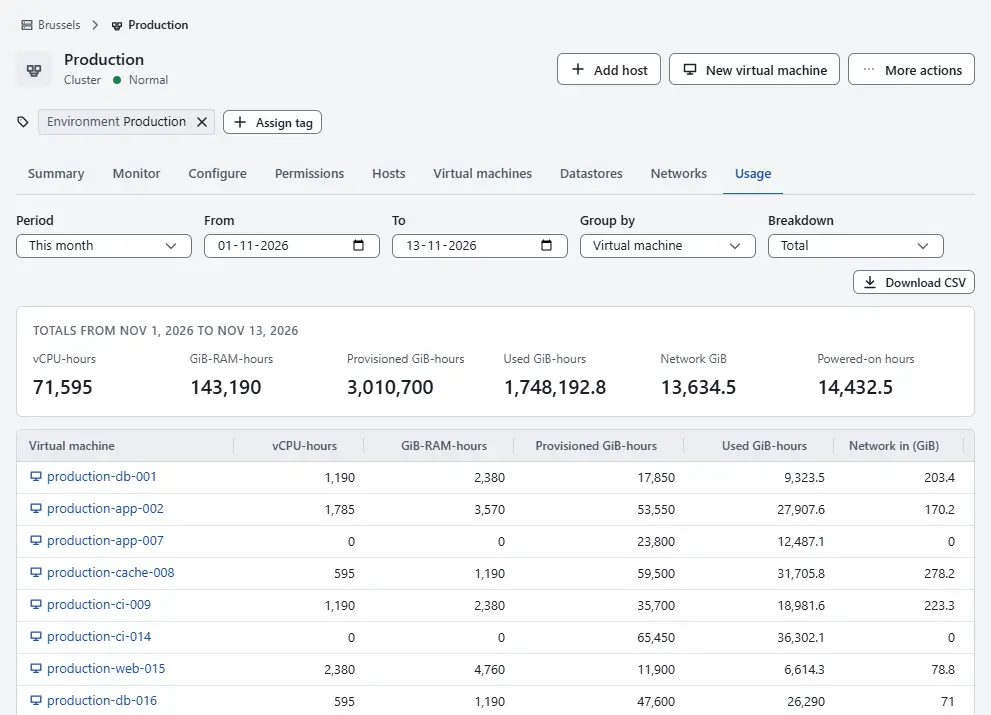
- Choose the period under Period: This month, Last month, Last 30 days or Custom. A custom period has From and To, and the end must not be before the start.
- Choose Group by: Virtual machine or Tenant. A tenant is a resource group or a folder, and a tenant line adds up the virtual machines inside it.
- Choose the Breakdown: Total, Per month or Per day.
- Read the totals above the table, then the lines. The columns are VMs (for tenants), Powered-on hours, vCPU-hours, GiB-RAM-hours, Provisioned GiB-hours, Used GiB-hours, Network in (GiB) and Network out (GiB).
- Select Download CSV to save the report as CSV. The file holds the same lines as the table.


Days are in UTC, and a report covers whole days, from the first to the last day inclusive. A report may span at most ten years. Hours count 20-second intervals, and storage counts whatever the power state of the virtual machine. The ledger keeps 400 days by default; the administrator changes that with ledger_retention_days in the section [metrics] of the controller configuration.
Result
The table shows the consumption of each virtual machine or tenant for the period, and the CSV file holds it for a billing system. A line has the period, the name of the group, and the figures above; ramGibHours counts the configured memory while the virtual machine is powered on.
Automation
With the CLI
kyvernon usage report --from 2026-11-01 --to 2026-11-30 --group-by tenant --period month
kyvernon usage report --from 2026-11-01 --to 2026-11-30 --group-by vm --period total --csv
kyvernon usage day 2026-11-12
--group-by is vm, tenant, resourcePool, folder or host, and --period is day, month or total. --scope <folder-id> counts only the virtual machines of a folder, cluster or resource group. usage day shows the summary of one day, the same document that webhooks receive.
With the API
GET /v1/usage takes from, to, groupBy, period, scope and format, which is json or csv. GET /v1/usage/days/{day} returns the summary of one day. A bad date, range, group, period, format or scope fails with a message id of the area usage, for example error.usage_bad_range.
Daily summary for chargeback
Once a day the controller sends the summary of the previous day to webhook subscribers, as the CloudEvents type kyvernon.usage.daily_summary. Subscribe with the event type UsageDailySummary and no tenant filter; see Webhooks. If the controller was down, it sends the days it missed, at most the last seven. A billing system can store each summary by its event id usage-<day> and drop repeats.
Related
- Traffic counts and limits the network traffic of a server.
- Performance charts the same virtual machines.
Version 0.1. Last changed: 2026-11-14